SAMPLE:
Why is this relationship important?
This relationship is important as when the market is in backwardation ( the Cash price is greater than the Cu3M price) and the market is moving up with falling stocks, it generally means that there is an increased demand for physical copper, which generally means higher prices.
In periods of low interest when the market is in contango (the Cu3M price is greater than the CuCash price) there may be buying of physical Copper to take advantage of the interest on the contango (providing that the warehousing costs are attractive).
(click on chart to enlarge)
|
CHART |
COMMENT |
|
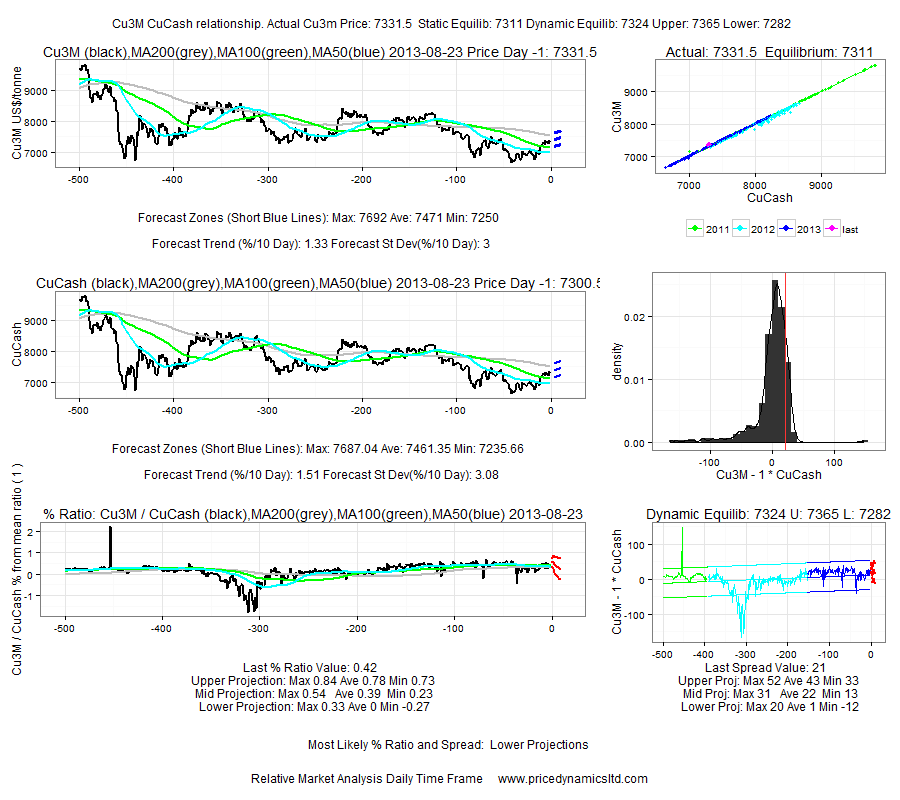
Cu3M price chart : (Top Left) |
The chart shows the Cu3m price over the last 500 days along with the 200,100 and 50 simple moving average. |
|
Cu Cash price chart : (Middle Left) |
The chart shows the Cu Cash price over the last 500 days along with the 200,100 and 50 simple moving average. |
| Cu3M:Cu Cash price ratio: (Bottom Left) | The chart shows the Cu3M:Cu Cash price ratio over the last 500 days |
|
Static Equilibrium: Scatterdiagram of the Cu3M price (y axis) and the Cu Cash price (x axis): (Top Right). |
Equilibrium Line: Best line through scatterdiagram. Equilibrium Price: Cu3M price corresponding to last point on the equilibrium line. |
| Distribution of Spread(Middle Right). x axis shows the Cu3m price movement around the equilibrium line. | SPREAD: Cu3M price minus the price on Static Equilibrium line. |
| Dynamic Equilibrium (Spread through Time): (Bottom Right) | Target Line:Best line through the Spread through time. Target Price: Cu3m price corresponding to last point on the target line. Upper & Lower: Price corresponding to 1standard deviation above and below the Target Price |
