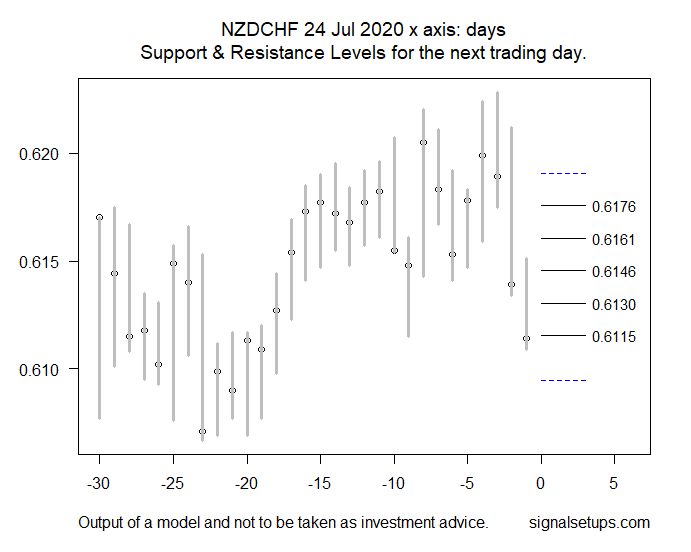
A retracement upwards is expected towards 0.6146-0.6176. An alternative bearish scenario would be further weakness below 0.6115 .
A retracement upwards is expected towards 0.6146-0.6176. An alternative bearish scenario would be further weakness below 0.6115 .
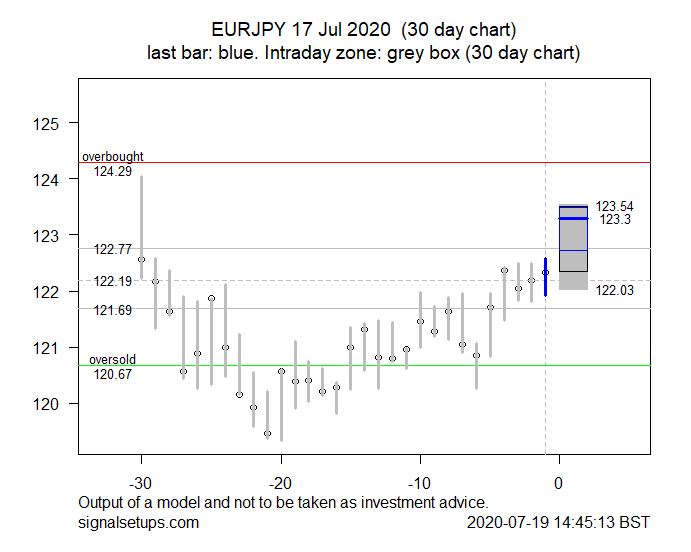
The model suggests that prices may break out of the “fair value” trading range and start to head up towards the 123.3 level. Alternate scenarios would be prices remaining in consolidation or breaking down below the lower end of the “fair value” zone at 121.69
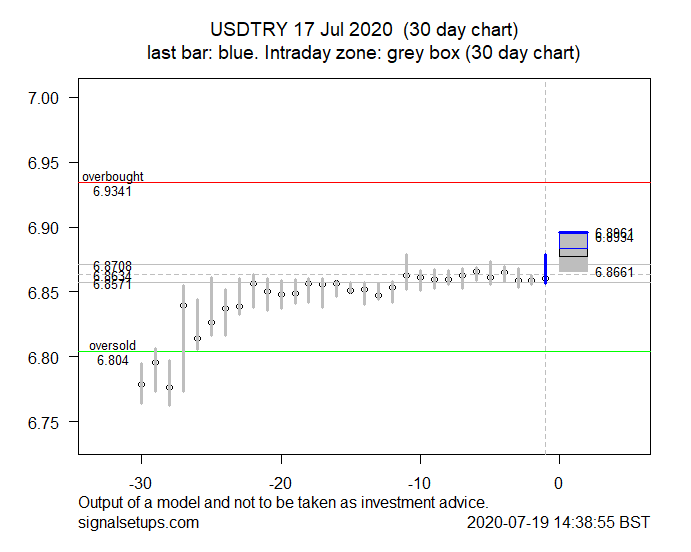
After a long period of consolidation, the model suggests that there may be a breakout upwards towards the 6.89 level. A alternate scenarios would be that prices continue to trade in the narrow consolidation range or that the price breaks down towards the oversold level.

The model suggests that the price may retest the recent bottom at around 16.557. An alternate scenario would be prices making a sustained move above 16.809.

Support may have been found at the 2.85 level. The price is expected to continue higher to 2.93 with resistance at 2.96

Double top at around historical resistance levels. A retracement down is expected.

Historical Resistance level reached. A retracement down is expected.

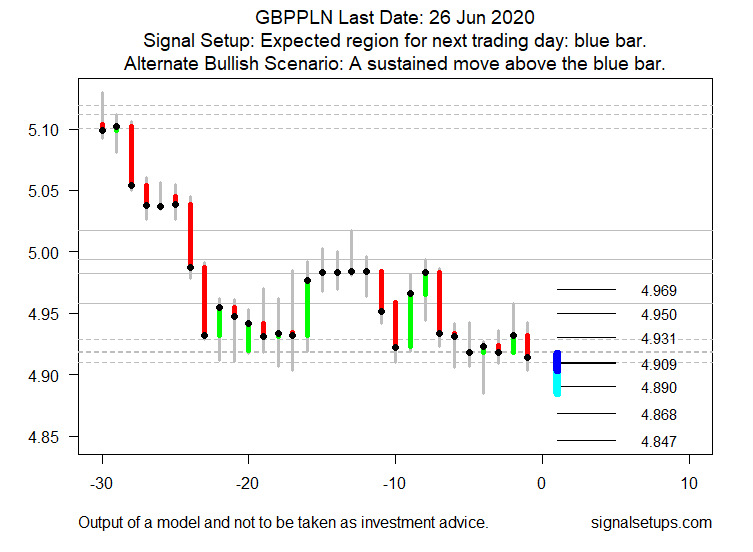
The price is close to historical support (dotted lines) . Looking for a break above the blue bar. Target around 4.79 where there is a historical resistance line close by.

If key resistance holds then a pullback is expected as shown by the blue bar.
If key resistance is broken then prices may head towards the 11.59 level.