What is Trend Tracker?
Trend Tracker is a Market Screening system that allows you to evaluate many different related markets quickly.
How can this help you?
- compare recent performance: see at a glance how well the different markets have been performing.
- spot entry points: see at a glance when markets have made the latest trend change.
- identify the trend: see at a glance whether the latest trend is up or down and whether the market is more likely to be heading towards support or resistance.
- identify a new trend change as it happens: if the price all outside the expected levels then the latest trend may be changing.
What reports are available?
Reports are available for:
- Metals ,Mining Equities & Related Markets
- Forex
- Indices & Sectors
- Commodities
- Major USA equities
- FTSE 100
Can you give us an example?
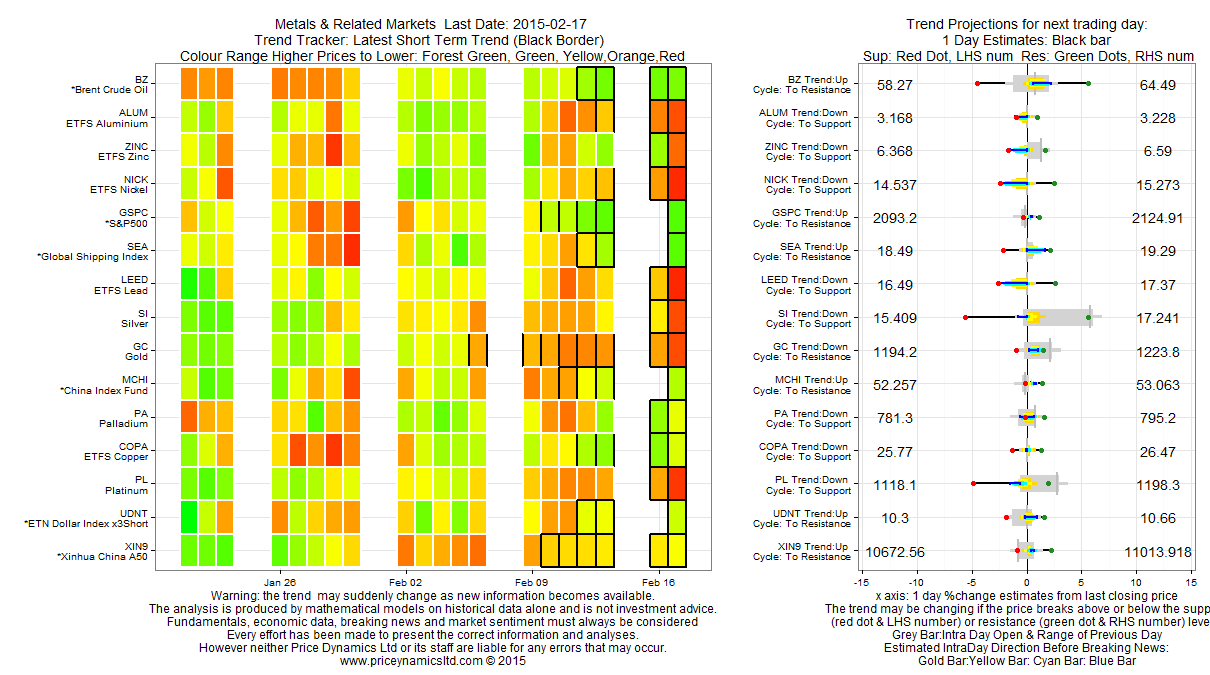
Below is an example from the Metals ,Mining Equities & Related Markets report:
Short Term Market Trends (left hand chart) & Estimates For Trend, Cycle, Support & Resistance For The Next Trading Day (right hand chart).
click image to enlarge
Ranking:The markets are ranked with those on the top having recently performed better than those below .
Left Hand Chart: The price history for the last 20 days, with green representing higher prices and red lower prices. The latest short term trend is highlighted by a black border.
Right Hand Chart Label: Shows whether the latest short term trend direction is up or down. The cycle direction estimates whether the price is moving to trend support or trend resistance.
Right Hand Chart x axis: %price change with zero representing the closing price of the previous day.
Right Hand Chart Expected Intraday Direction:Gold Bar followed by Yellow Bar, followed by Cyan Bar, followed by Blue Bar .
Right Hand Chart S&R: Support is shown by the red dot & LHS number. Resistance by the green dot & RHS number. Price moves outside these levels indicate that the trend may be changing.
Right Hand Chart Grey Bar:The grey bar shows the price movement for the previous day.If the grey bar is below x axis zero, the price went up the previous day. If above, the price went down.
Adjustments have to be made to these estimates on breaking news.
Good news favours a move to the resistance levels.
Bad news to the support level.
Breaking these levels may start a new short term trend.
